
My contribution:
UX Designer/Researcher
UI Lead:
Survey page
Project Manager
Deliverables:
High fidelity Prototype
Functional Live Website
Team:
UX Designers
Mujtaba Khan
Cameron Locke
Kate Lee
Software Engineers
Cindy Wong
Morteza Maddahi
Mary Sanni
UX Researchers
Lena Carlson
Vin O’ Dowd
Paul Chi
Timeframe:
1 Week
🎉 MAY 2023 HACKATHON WINNER 🥇
OVERVIEW
Broad, open-ended, and full of possibilities
With so many ways to tackle this theme and mere days to conceptualize a product, our team honed in on a critical piece to bridging the digital divide in education: access to devices within the classroom.
PROBLEM
This project was created as part of a 9-person team in the 5-day hackathon hosted by General Assembly. The theme of the May 2023 Hackathon was Digital Equity & Accessibility
We asked ourselves: How can we help underserved students cross the digital divide and catch up to their peers in wealthier communities?
RAPID IDEATION

INFO
Our team came up with the idea of Give2Learn, a non-profit organization dedicated to helping meet the growing demand for technology in classrooms and promote digital inclusion by supplying refurbished tablets and laptops to underserved schools.
The idea behind this platform is that our organization takes old, unwanted technology from generous donors and refurbishes them to provide students in underserved schools with the technology they need in the classroom. These schools are given the opportunity to request devices to ensure their students are well-equipped with the learning tools they need to succeed in their academic studies.

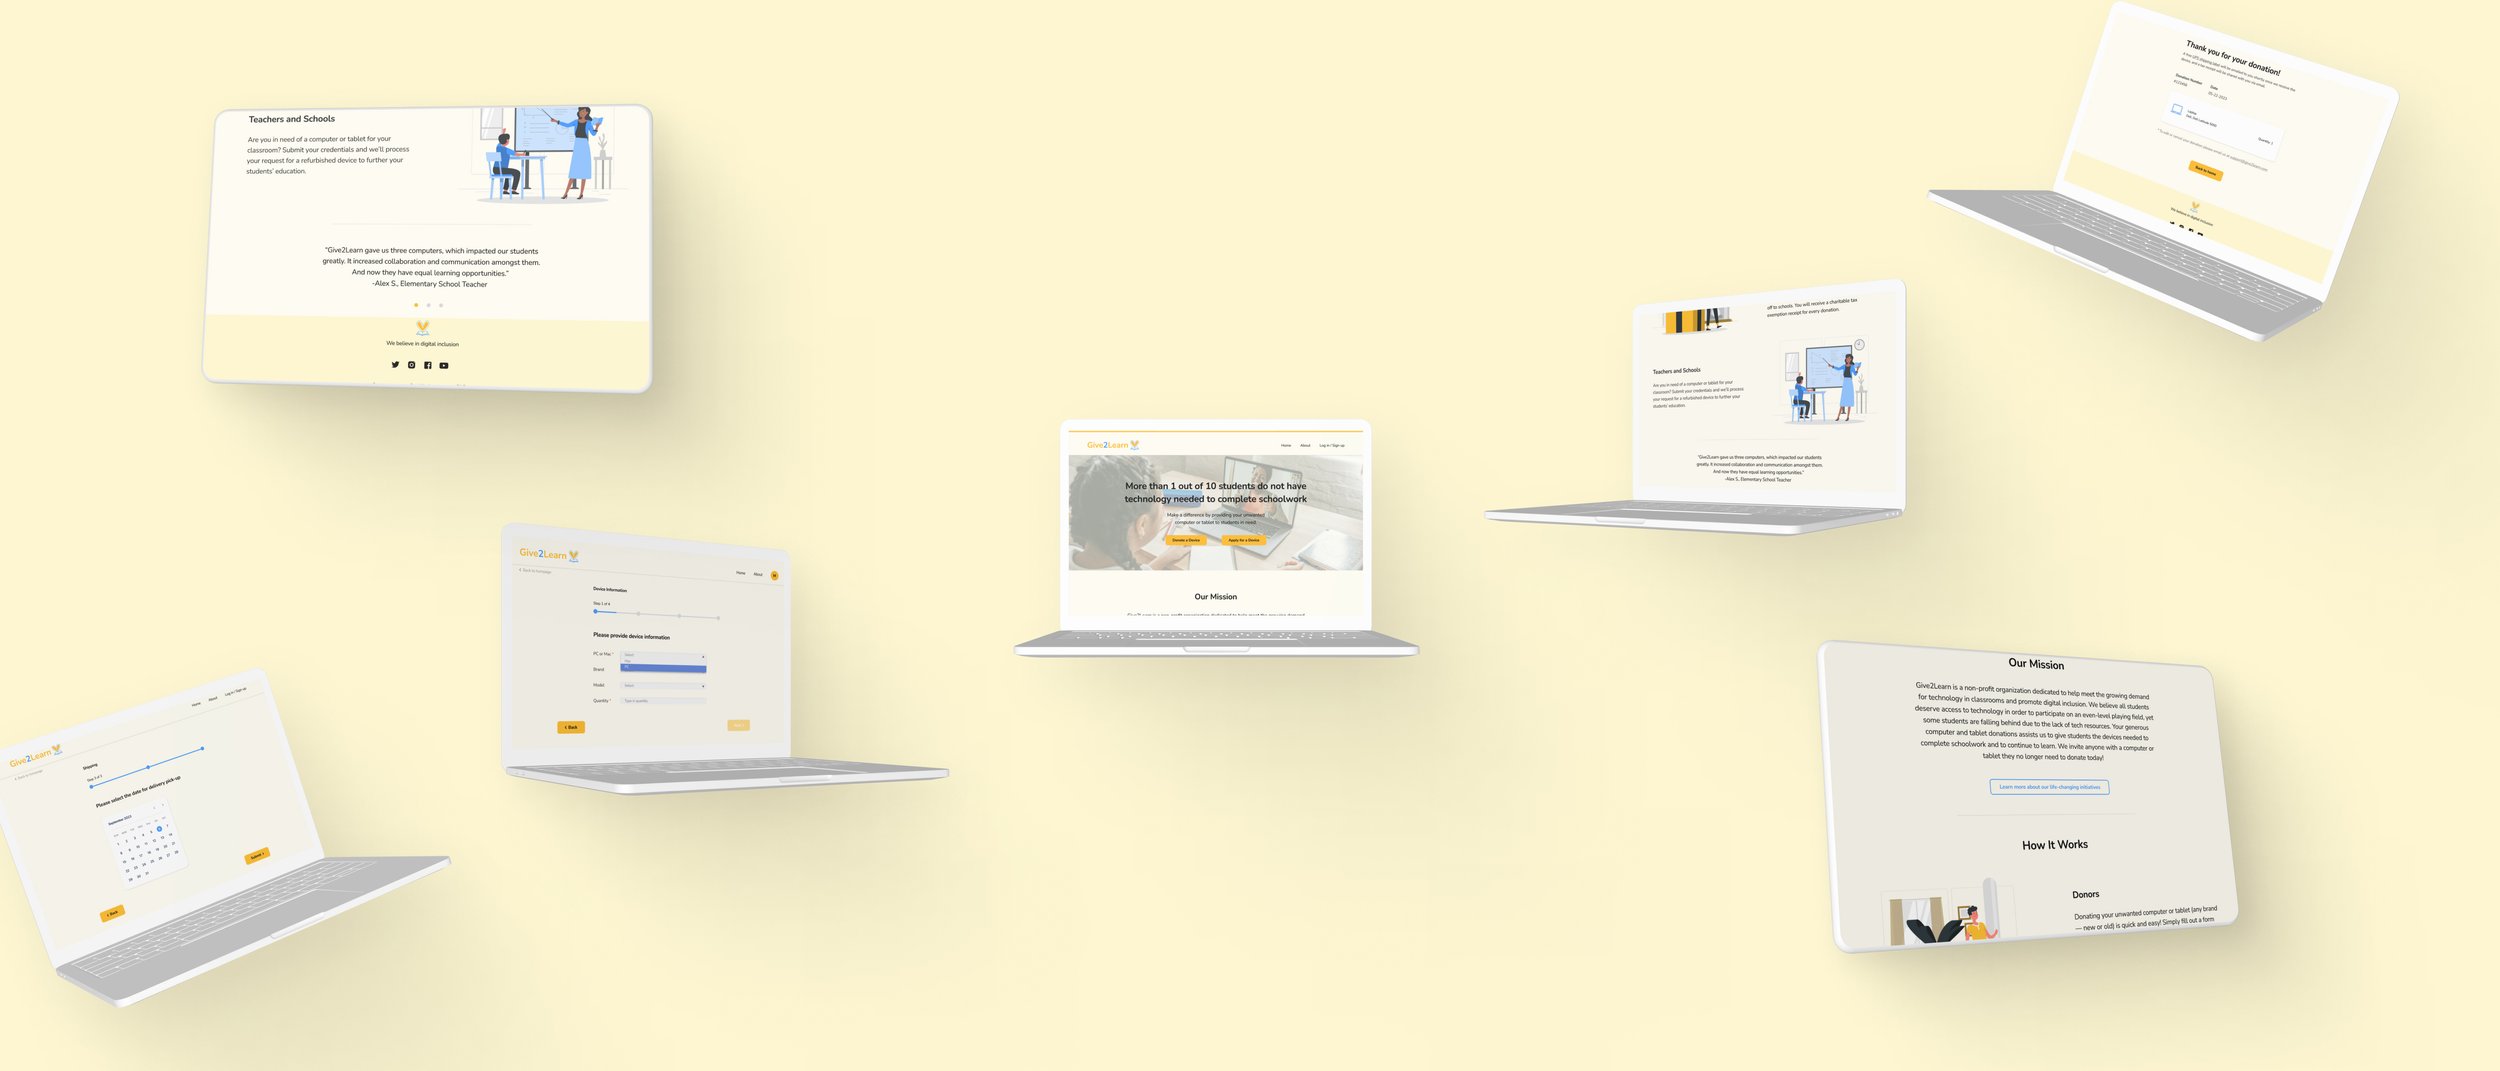
Give2Learn Homepage
A major component of our MVP was to create a solid, front-facing homepage to ensure users have a clear idea of what our organization is about. The design focuses on clear call-to-actions and a simple layout.

FOCUSING ON TECHNOLOGY ACCESS IN K-12 CLASSROOMS
With an incredibly short timeline, our team spent just a few hours determining our design strategy. Our team thought about ways in which the digital divide affected various areas of society. In the end, we went with a broader idea: to solve an overarching issue around access to devices within education for K-12 students.
In order to kick off work for the researchers, designers, and developers, we wanted to hit the ground running by giving each “mini-team” something to work on as soon as possible. For those of us working on research, we first sought to validate that the problem existed, given that this problem began as an assumption.

SOLUTION
VALIDATING THE PROBLEM
With only 5 days to craft a product to reflect the Digital Equity and Accessibility theme, our team created two main features as our MVP. We wanted to build a homepage to capture the users’ attention and we wanted to ensure the message of our conceptual organization was clear. Our team also conceptualized two flows: a “donation flow” and a “request flow,” which were two separate forms for the donor and the requester (a teacher, for example).

HOW DID OUR USERS INTERPRET OUR DESIGNS?
IDENTIFYING SCOPE &
OUR MVP
We all dove headfirst into this project, knowing that the development team would probably have the most difficult job since they would have to build all of our designs from scratch.
To help the development team begin their work right away, the design team produced wireframes that were the skeleton of our website to hand off to the development team with the idea that these frames would give them a baseline infrastructure to work with while the rest of the UX team worked on research and design.
BASELINE WIREFRAMES
USABILITY TESTS: ROUND #1

Another goal was to work closely with developers and understand the relationship between UX and Development. The biggest takeaway from working with developers is that there were a good handful of times when, as designers, we had to compromise on a certain aspect of the design. For example, on our homepage, the developers were unable to build a carousel, so for our MVP, we stuck to a static image with indicators of a would-be carousel. As much as we tried to account for the amount of work we placed on the developers, there were still quite a few areas we had to compromise on, and that was a great learning experience
Our first usability test utilized mid-fidelity wireframes and aimed to check our website’s functionality before we moved too far into our high-fidelity wireframes.
The biggest takeaway was that, overall, applying for or donating a device was very easy, which was great news for us! Most user feedback revolved around cosmetic and copy changes or logistical questions that would be addressed if this concept became a reality.
Our second usability test utilized high-fidelity wireframes and was intended to further improve the user experience. We wanted to ensure users were experiencing the most seamless process as they donated or requested a device.
The main issue users were having was in our donation flow, where the calendar for a device pickup allowed users to select multiple dates. We revisited this feature to ensure the constraint of only allowing users to choose one date was implemented.

BEFORE - Calendar with multiple selection dates
AFTER - Calendar with Single selection dates
USABILITY TESTS: ROUND #2
BRAND IDENTITY
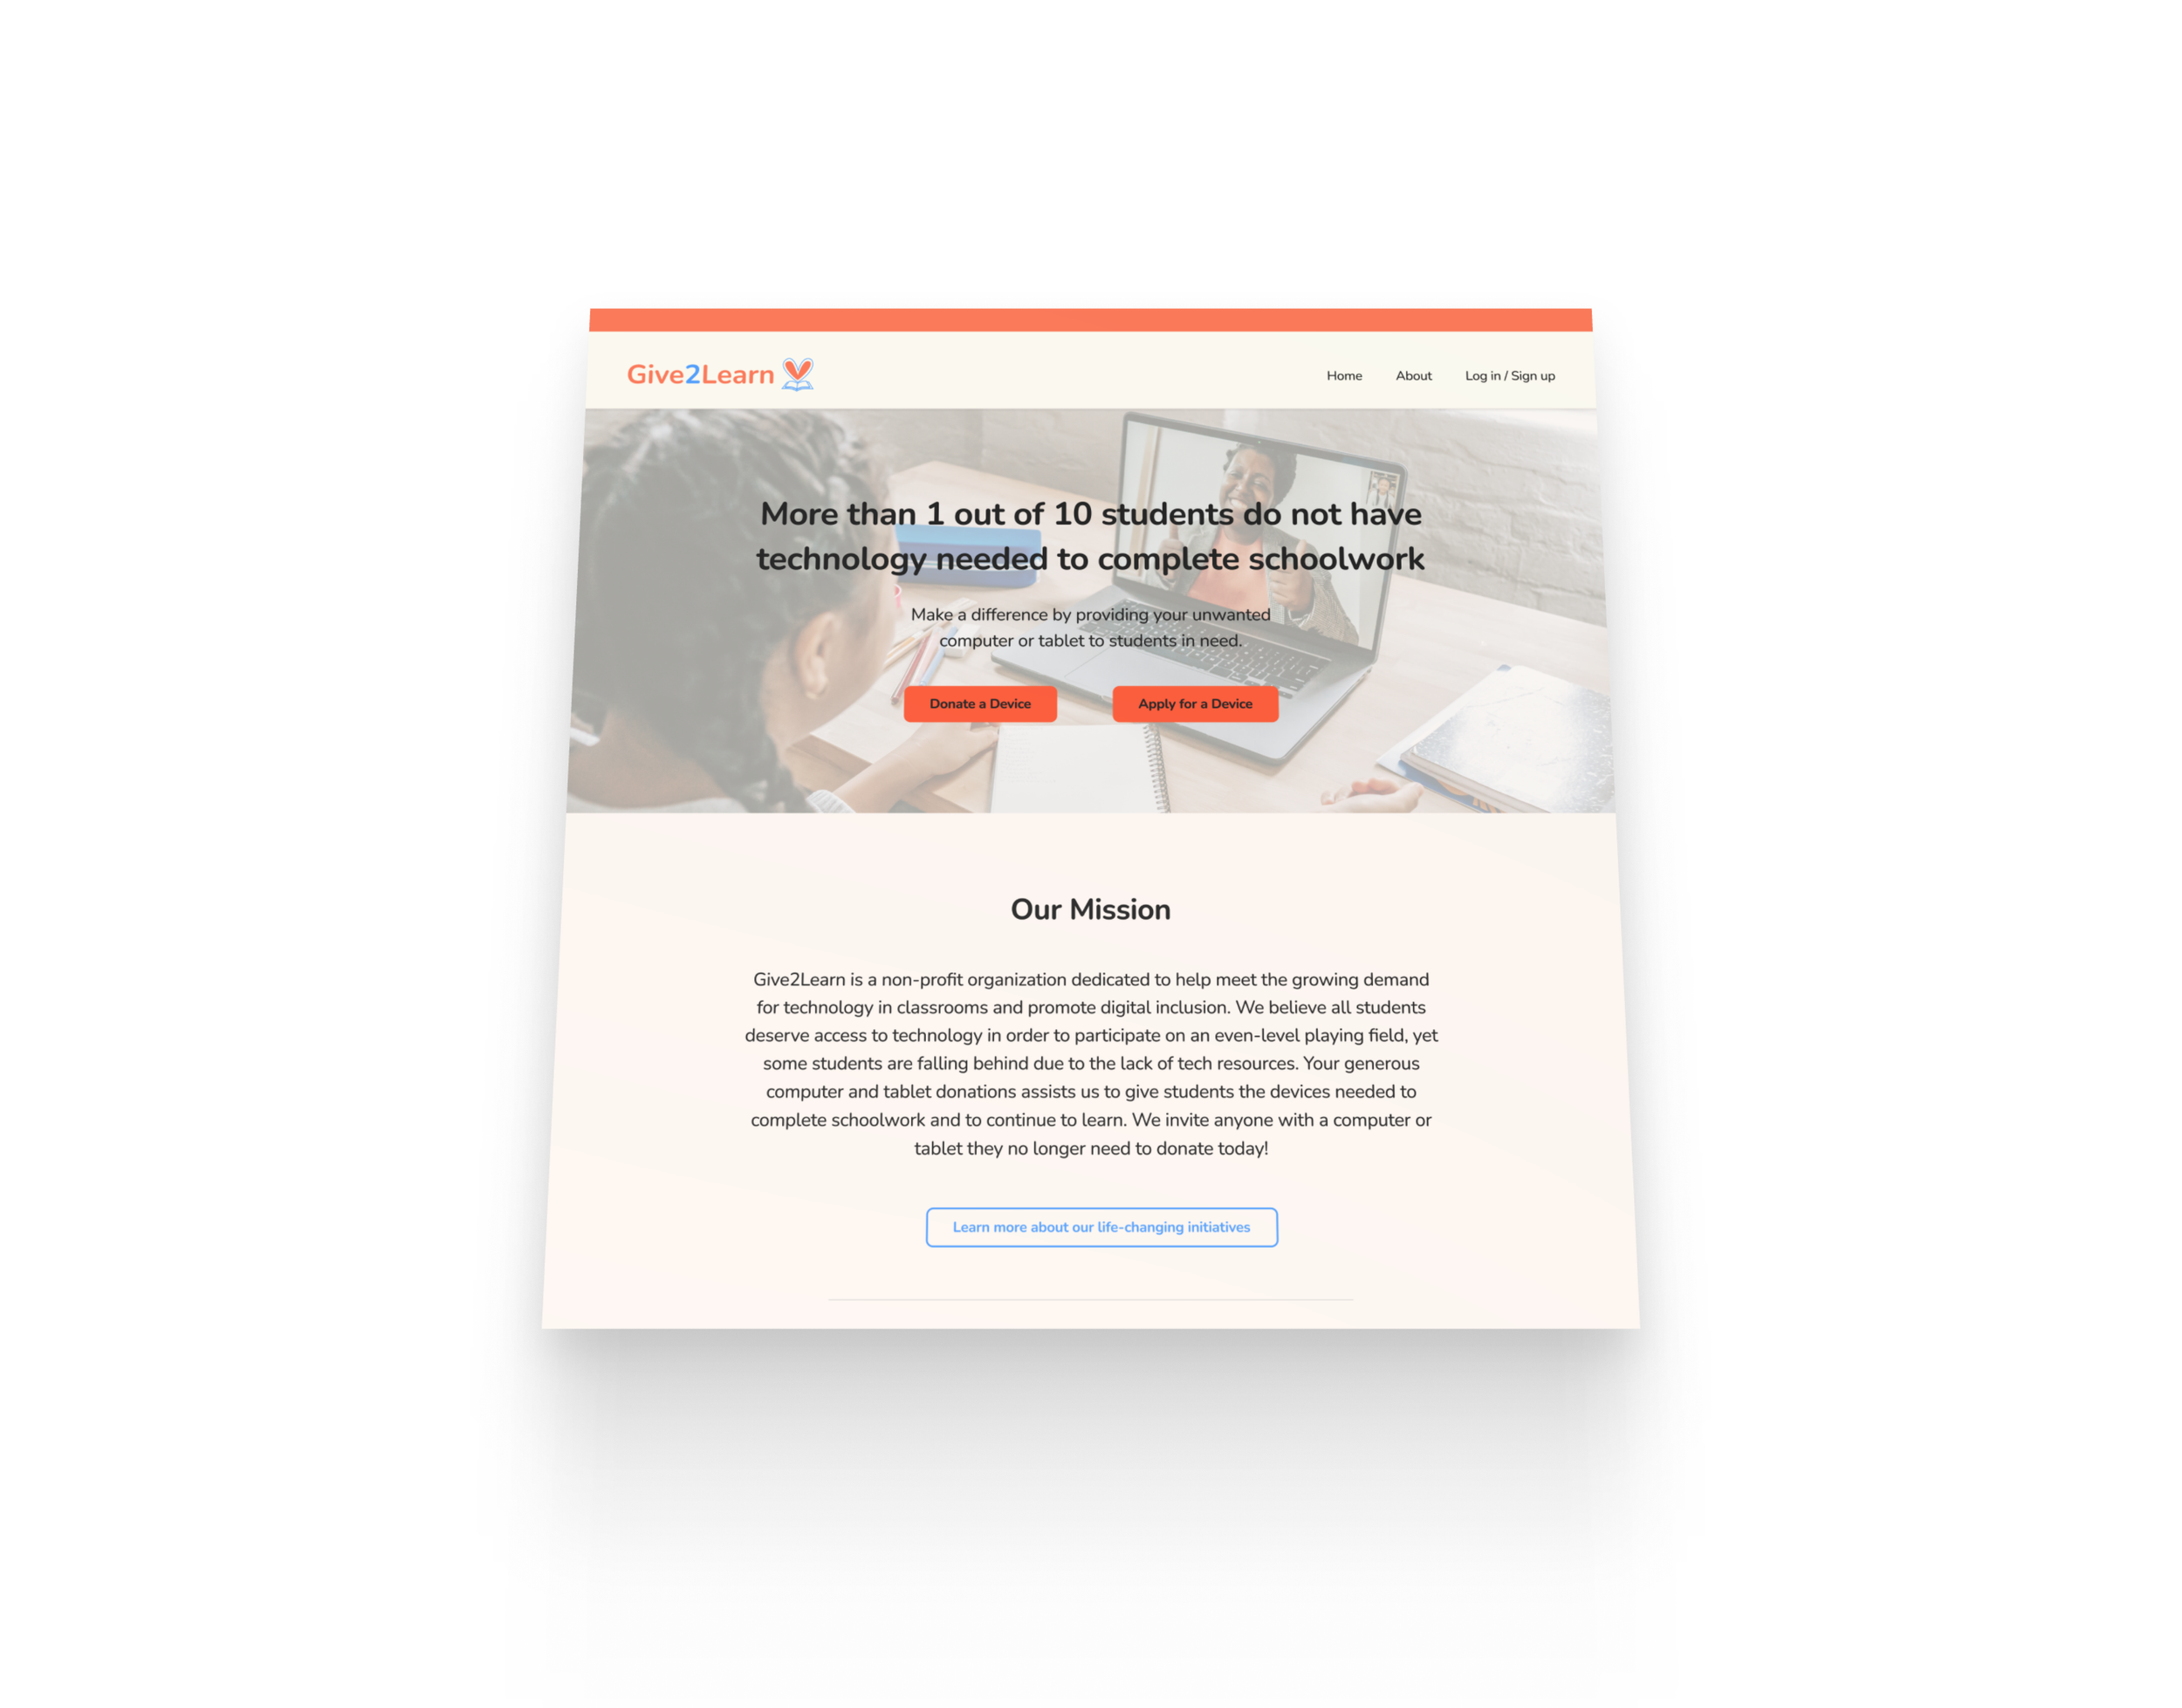
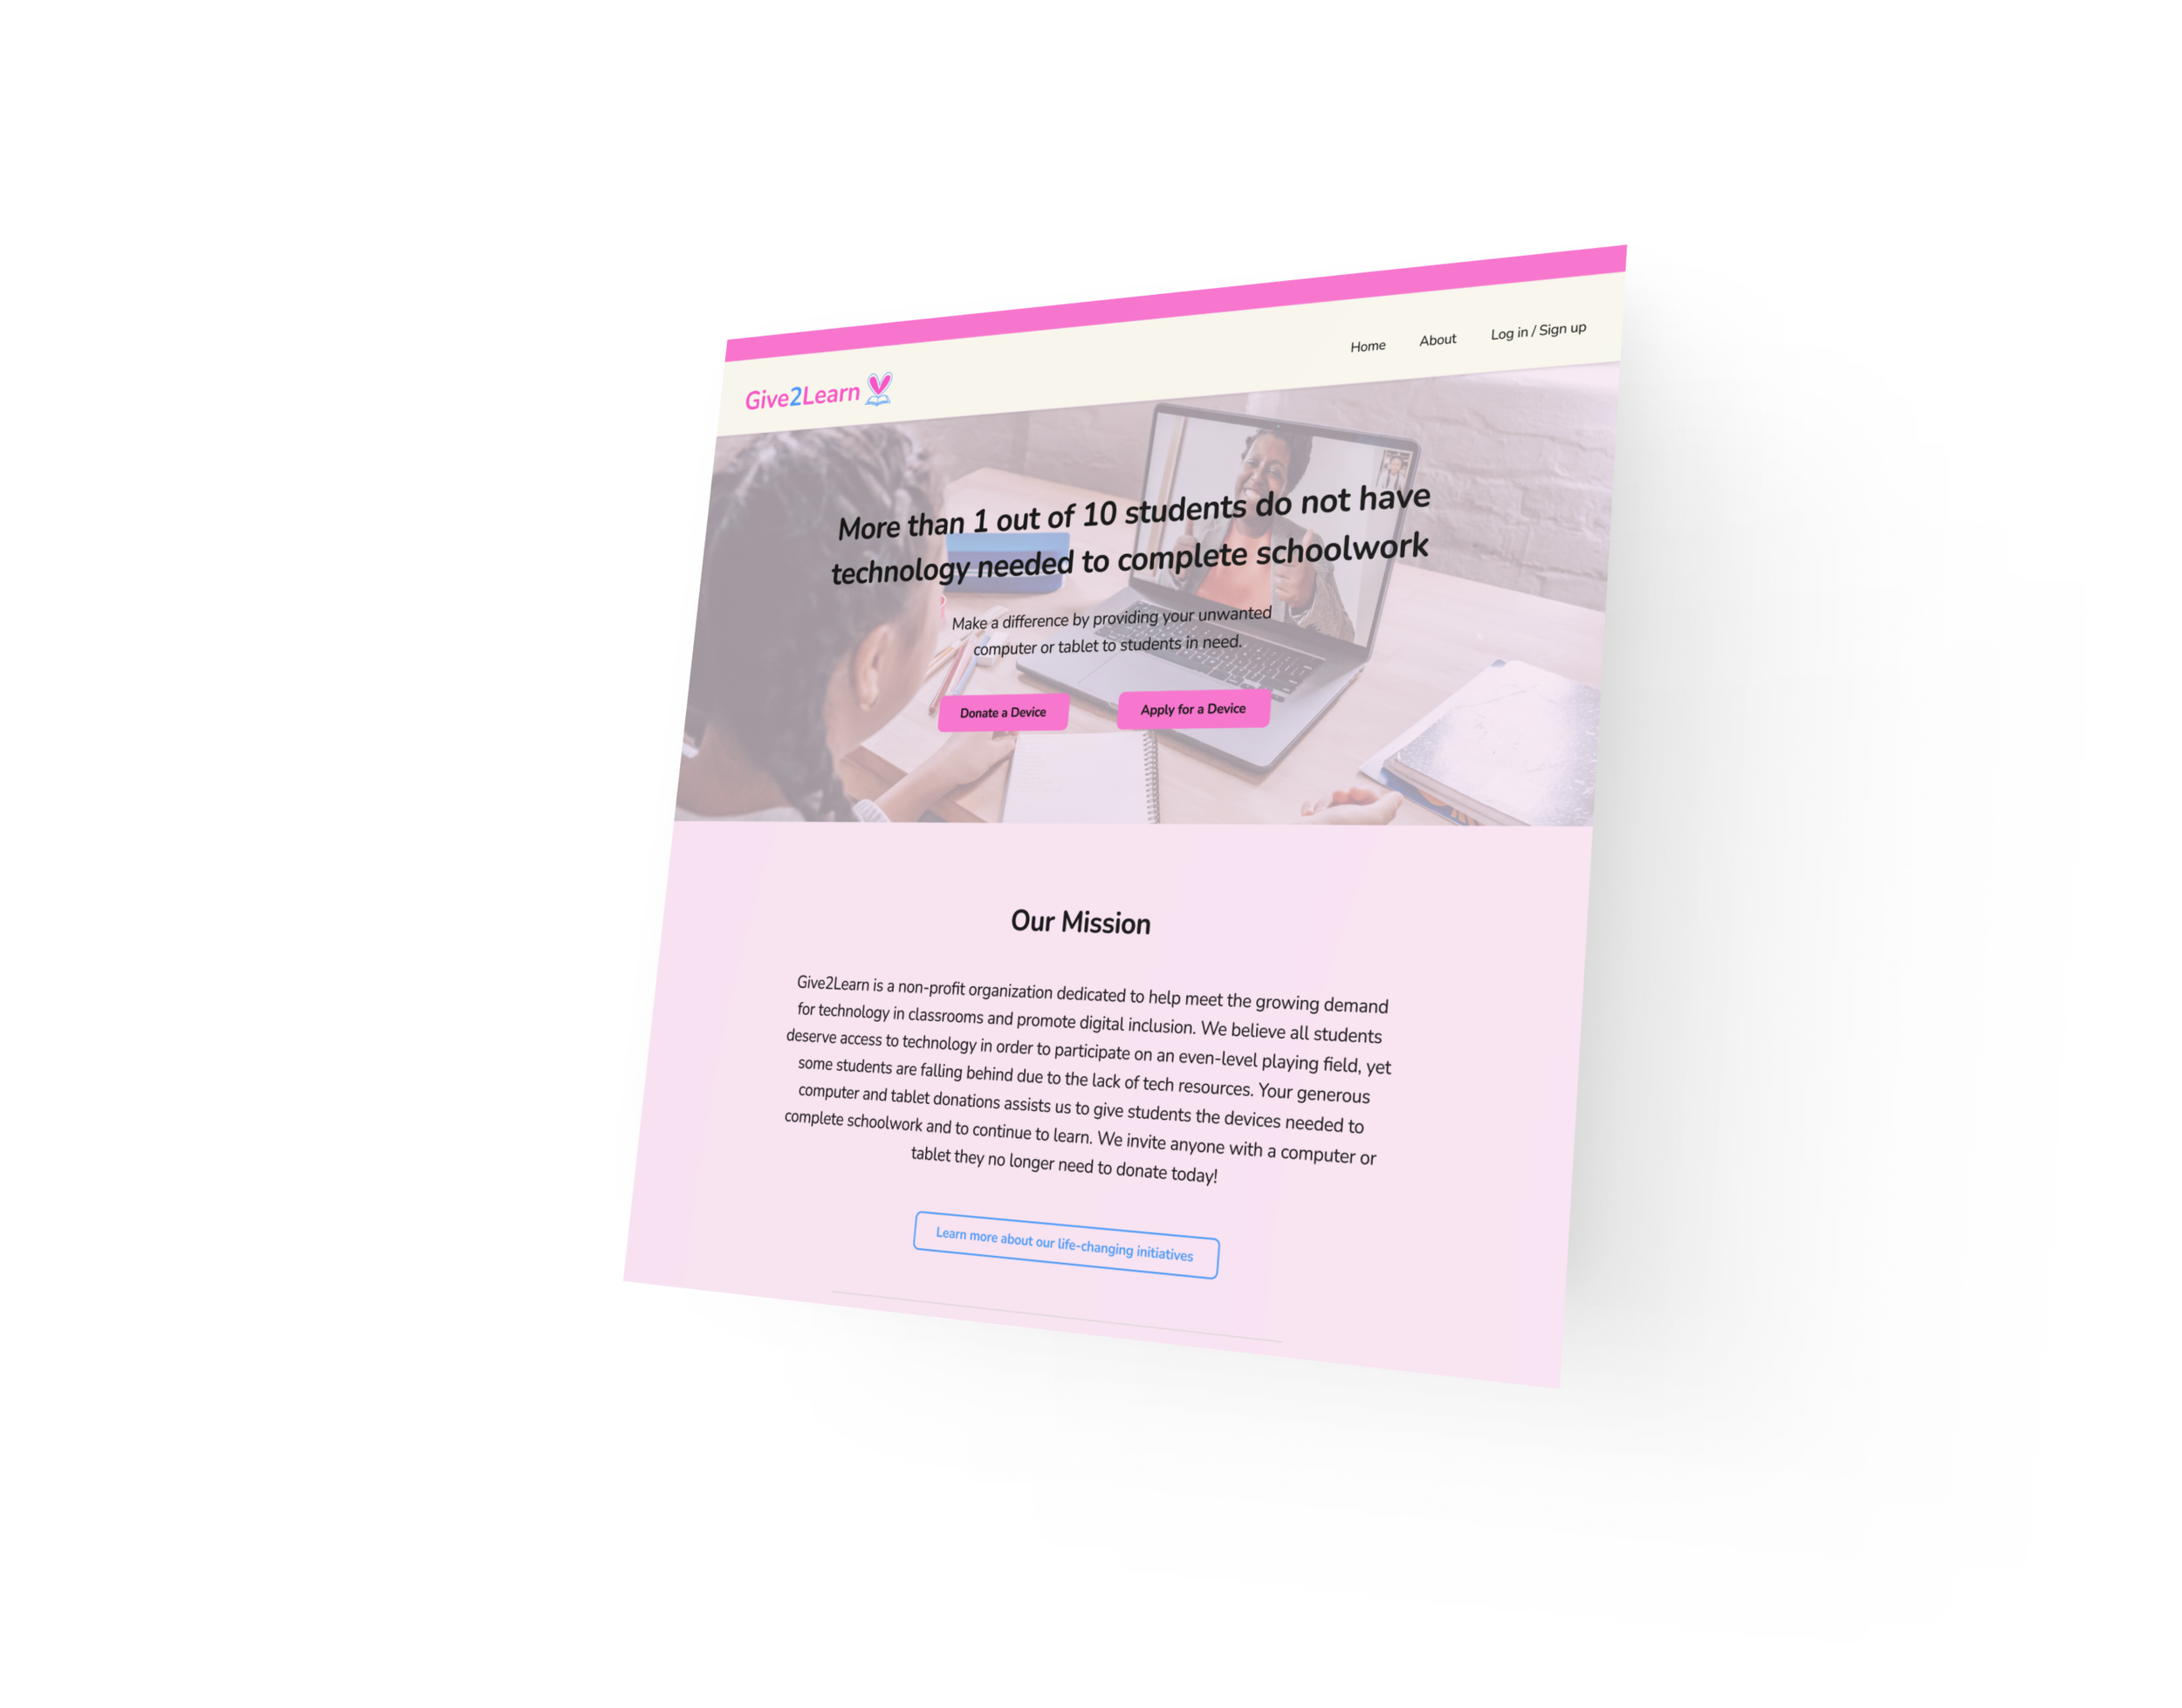
WHY THESE COLORS & TYPEFACE
We explored several color palettes with the intention of making the website feel warm, playful, and kid oriented. we chose a clean, rounded, sans serif typeface to match that feeling.
We wanted to ensure that our website was easily scannable, readable, and that the colors weren’t too jarring to the eye
1.)One major goal of mine was to focus more on design/UI, and I learned a lot from those with more experience than I do. From tools to improving my design eye, I was able to gain insights on how I can improve my own design processes.
PROJECT TAKEAWAYS
If our team continued working on this project, we would build out other core pages, such as the “my profile” or “my applications” page, that would be crucial to have in a fully conceptualized product model